Most users interact with spreadsheets one cell at a time. They drag formulas down columns, manually update ranges, and use clunky nested IF statements to summarize data. This approach is slow, prone to error, and unsustainable for large datasets.
The secret to scaling your reporting and data analysis lies in mastering Spreadsheet Array Formulas and Aggregation. These advanced techniques allow you to process entire columns and tables simultaneously with a single formula, transforming your spreadsheet from a static ledger into a dynamic, real-time reporting engine.
This guide will walk you through the three pillars of high-efficiency spreadsheet automation, moving you beyond basic formulas into the realm of professional data manipulation.
Pillar 1: Conditional Aggregation (The Reporting Workhorse)
When you need to count, sum, or average data based on one or more conditions—like finding the total sales for “Client A” in the “East Region”—you need Conditional Aggregation functions. These are the workhorses of business reporting.
A. Moving Beyond the Simple IF
Traditional reporting often requires using the simple SUMIF function (e.g., sum sales if the status is “Completed”). However, real-world data requires matching multiple criteria (e.g., “Completed” and “Q3 2025”).
This is where the plural forms—SUMIFS, COUNTIFS, and AVERAGEIFS—become mandatory.
B. Understanding the Syntax Shift
The syntax for SUMIFS is counter-intuitive compared to SUMIF, but it is far more powerful. The key difference is that the Sum Range always comes first.
| Function | Purpose | Syntax Structure |
|---|---|---|
SUMIFS | Sums based on multiple conditions. | =SUMIFS(sum_range, criteria_range1, criteria1, criteria_range2, criteria2, ...) |
Practical Example: Multi-Criteria Sales
Imagine a sales table in columns A:E. You want to find the total revenue for “Project Alpha” that was closed in “Q4”.
The Formula: =SUMIFS(E:E, B:B, "Project Alpha", C:C, "Q4")
E:E(Sum Range): The column containing the dollar values (the revenue).B:B(Criteria Range 1): The column containing project names."Project Alpha"(Criteria 1): The specific project name to match.C:C(Criteria Range 2): The column containing the quarter."Q4"(Criteria 2): The specific quarter to match.
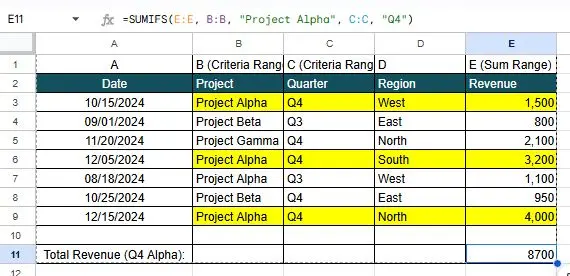
This single formula instantly scans thousands of rows, applies both filters simultaneously, and returns the accurate total.
C. Leveraging Dynamic Criteria
Conditional Aggregation works best when criteria are pulled from a reporting cell, making the formula dynamic.
The Dynamic Formula: If cell G1 contains the Project Name and cell G2 contains the Quarter: =SUMIFS(E:E, B:B, G1, C:C, G2)
Now, changing G1 from “Project Alpha” to “Project Beta” instantly updates the entire report, a core tenet of efficient Spreadsheet Array Formulas and Aggregation.
Pillar 2: Mastering Array Formulas (The Batch Processor)
While conditional aggregation summarizes data, Array Formulas are used to perform complex, row-by-row calculations across an entire column using only one formula written in one cell.
A. What is an Array Formula?
An Array Formula is a special type of formula that instructs the spreadsheet engine to perform an operation on a range of cells (an array) and then output the result into a corresponding range of cells.
In Google Sheets, you use the ARRAYFORMULA() wrapper. In modern Excel, this behavior is often automatic and is known as Spilled Arrays.
B. The Efficiency Gain: Calculating Commissions
Consider a scenario where you have 5,000 sales in Column E and need to calculate a 15% commission for each in Column F.
The Old Way (5,000 Formulas):
- In
F2, enter=E2 * 0.15. - Drag the formula down to
F5001.- Downside: Your spreadsheet stores 5,000 individual formulas, which slows down calculation time and leaves 5,000 opportunities for accidental deletion or corruption.
The Array Formula Way (1 Formula):
- In cell
F2, enter the following formula:=ARRAYFORMULA(E2:E * 0.15)
The Result: The formula in F2 automatically “spills” down, calculating the commission for every single row in Column E.
- Benefit 1: Speed and Stability: Only one formula exists in the entire column. If a new row of data is added, the array formula instantly extends to cover it, requiring zero maintenance.
- Benefit 2: Scalability: This single formula is far more efficient for the spreadsheet engine to process than thousands of individual calculations, directly supporting faster Spreadsheet Array Formulas and Aggregation.
C. Array Formulas with IF Statements
Array Formulas are essential for dynamic column generation. If you want to categorize every sale as “High Value” (over $10k) or “Standard” across the entire column:
The Formula in F2: =ARRAYFORMULA(IF(E2:E > 10000, "High Value", "Standard"))
This single formula automatically populates the category for every row, making it a cornerstone of Spreadsheet Array Formulas and Aggregation.
Pillar 3: Advanced Array Logic (FILTER and QUERY)
For maximum productivity and flexibility, especially in Google Sheets, you must combine array concepts with powerful functions that act as miniature database engines inside your spreadsheet.
A. The Power of the FILTER Function
The FILTER function is a dynamic, array-based alternative to manual copy/pasting filtered data. It takes an entire dataset and returns only the rows that match a specified condition.
Scenario: Extract only the rows corresponding to “Q3” sales for a manager’s report.
The Formula: =FILTER(A:E, C:C = "Q3")
A:E: The entire dataset you want to filter and return.C:C = "Q3": The condition to check (Is the value in column C equal to “Q3”?).
The Result: This formula, entered in one cell, instantly returns a dynamic, spillable table containing only the Q3 sales data. If you change a row’s quarter in the source data, the filtered table automatically updates. This dynamic reporting is critical for high-level Spreadsheet Array Formulas and Aggregation.
Also read: Spreadsheet Lookup and Validation: Ensuring Data Integrity and Speed
B. Introducing the Ultimate Tool: The QUERY Function (Google Sheets)
The QUERY function, exclusive to Google Sheets, is the most powerful aggregation tool. It allows you to write simple SQL-like commands directly into a cell, enabling complex aggregation, filtering, sorting, and grouping.
Scenario: Calculate the total sales by Region, but only for “Widgets” sold in 2025, and sort the results.
The Formula: =QUERY(A:E, "SELECT D, SUM(E) WHERE B='Widget' AND YEAR(A) = 2025 GROUP BY D ORDER BY SUM(E) DESC")
SELECT D, SUM(E): Choose the Region (D) and sum the Sales (E).WHERE B='Widget' AND YEAR(A) = 2025: Filter for Widget sales in 2025.GROUP BY D: Group the results by Region.ORDER BY SUM(E) DESC: Sort the final results by total sales, descending.
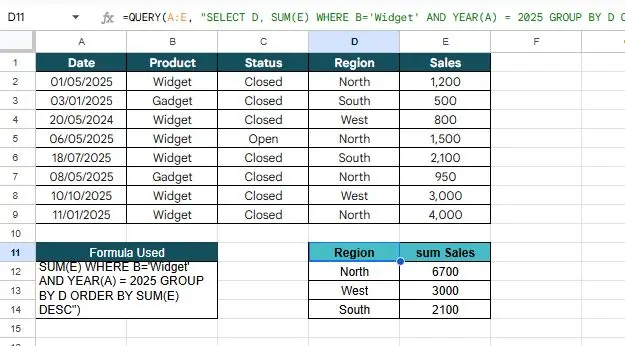
The QUERY function handles all the filtering and aggregation logic—something that would require dozens of SUMIFS formulas and manual pivot tables—with a single line of code, representing the pinnacle of Spreadsheet Array Formulas and Aggregation.
Frequently Asked Questions (FAQ)
Q: Why should I use SUMIFS instead of a Pivot Table?
A: Pivot Tables are excellent for quick, ad-hoc reporting. However, SUMIFS is better when: 1) You need to combine the result with other formulas (e.g., calculating a bonus based on a sum). 2) You need the report to stay in a fixed location and look exactly the same every time, using pre-designed report templates. 3) You need real-time updates linked to specific report cells.
Q: What’s the biggest pitfall of using Array Formulas?
A: The main pitfall is array collision. If you enter an Array Formula in F2 that intends to “spill” results down to F100, but there is any static data (even a space) in cells F3 through F100, the formula will return an error (usually REF! or “Array result was not expanded”). You must ensure the destination range is completely clear before entering the Array Formula.
Q: When should I use FILTER vs. QUERY (in Google Sheets)?
A:
- Use
FILTERfor simple extraction where you are only filtering rows and need all columns. It’s faster and easier to write. - Use
QUERYwhen you need advanced aggregation (SUM, AVG, COUNT), grouping, sorting, or complex date manipulations.
Conclusion: Data Automation in a Cell
Mastering Spreadsheet Array Formulas and Aggregation is the fastest way to leave behind manual data cleanup and embrace automation. By using the dynamic power of SUMIFS for multi-criteria reporting and the flexibility of ARRAYFORMULA, FILTER, and QUERY for data manipulation, you ensure that your spreadsheets are stable, fast, and always up-to-date. This discipline minimizes the opportunities for error, maximizing your team’s confidence in the underlying data.